- Análisis
- Análisis Técnico
USD/JPY Análisis Técnico - USD/JPY Trading: 2016-12-27
Significant economic data will come out in Japan
On Tuesday early in the morning the inflation data and household spending for November will come out in Japan. We believe they may make yen a bit stronger. Will USDJPY chart fall?
Due to preliminary forecasts, household spending rose in Japan in November for the first time since this February. This may revive the economy. Moreover, despite the expected same pace of core deflation year over year, it may fall in November to -0.3% from -0.4% in October 2016. The Bank of Japan aims at fighting deflation and reaching 2% inflation. Weak consumer confidence for December is expected to come out in US on Tuesday which may support the yen rate against the US dollar. Manufacturing production for November will come out in Japan on Wednesday. According to forecasts, they may be positive for the yen. Next significant data will come only on January 4, 2017.
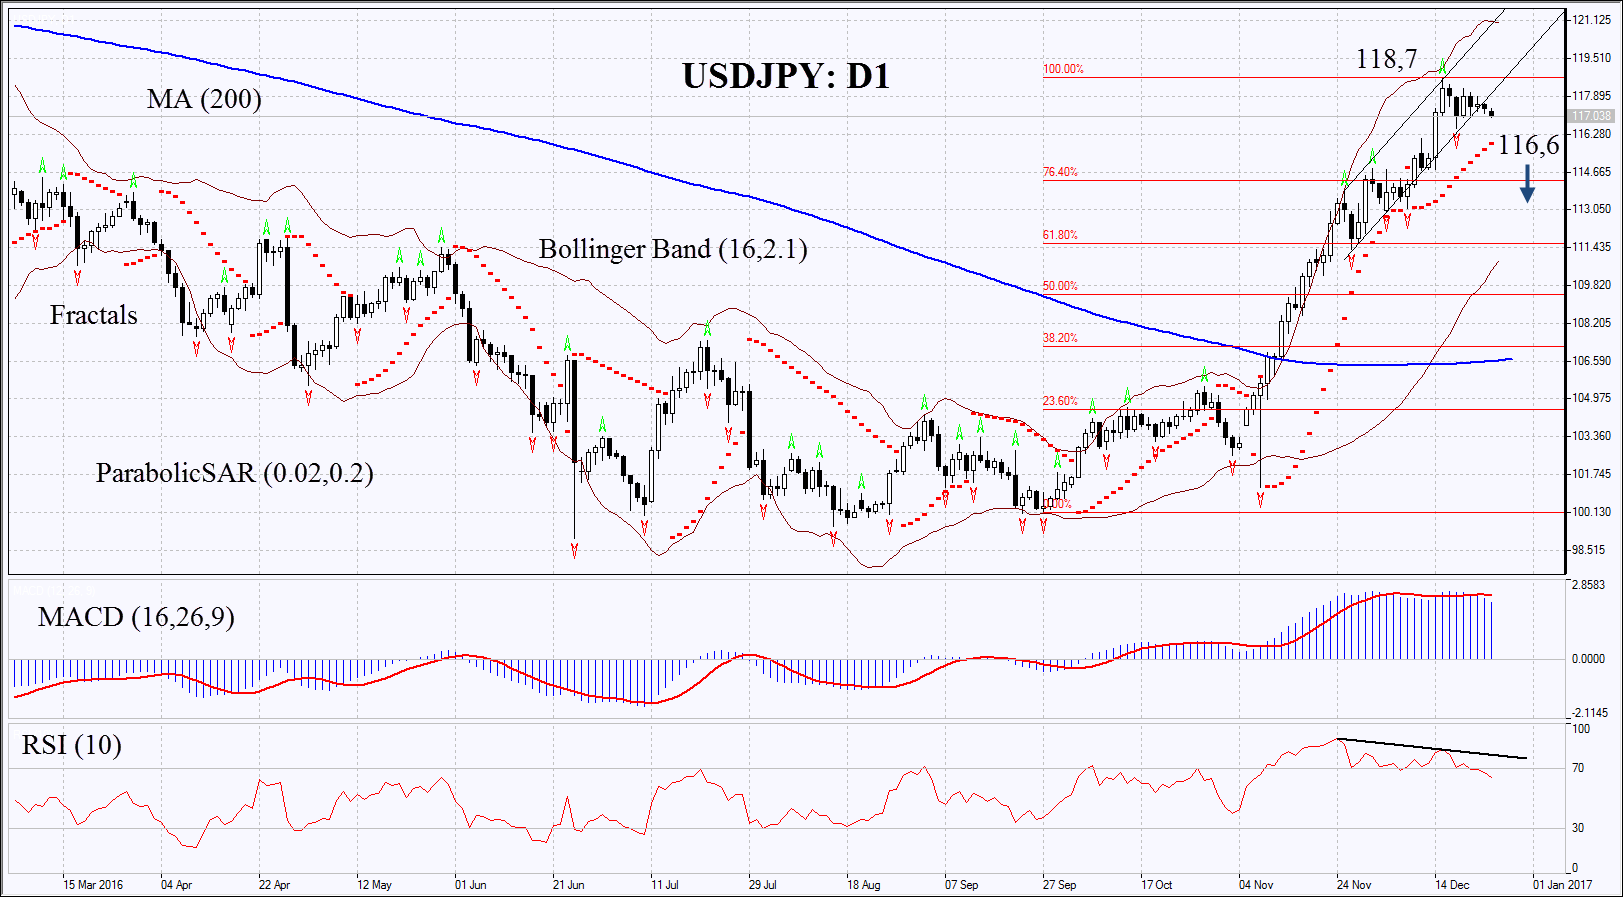
On the daily chart USDJPY: D1 is trending upwards. It hit a 11-month high two weeks ago. Now the pace of growth has slowed down and several technical indicators point at the chance of downward correction. Further strengthening of yen is possible in case of positive economic data in Japan and negative in US.
- Parabolic gives bullish signals which may serve an additional level of support. In such a case the price shall fall below the support to open a position.
- Bollinger bands have widened which means higher volatility.
- RSI has left the overbought zone having formed negative divergence.
- MACD gives bearish signals.
The bearish momentum may develop in case USDJPY falls below the last fractal low at 116.6. This level may serve the point of entry. The initial stop-loss may be placed above the 11-month high at 118.7. Having opened the pending order we shall move the stop to the next fractal high following the Parabolic and Bollinger signals. Thus, we are changing the probable profit/loss ratio to the breakeven point. The most risk-averse traders may switch to the 4-hour chart after the trade and place there a stop-loss moving it in the direction of the trade. If the price meets the stop-loss level at 118.7 without reaching the order at 116.6, we recommend cancelling the position: the market sustains internal changes which were not taken into account.
Summary of technical analysis
| Position | Sell |
| Sell stop | below 116.6 |
| Stop loss | above 118.7 |
- Obtener certificado

Nota:
Este resumen tiene carácter informativo-educativo y se publica de forma gratuita. Todos los datos que contiene este resumen, son obtenidos de fuentes públicas que se consideran más o menos fiables. Además, no hay niguna garantía de que la información sea completa y exacta. En el futuro, los resúmenes no se actualizarán. Toda la información en cada resumen, incluyendo las opiniones, indicadores, gráficos y todo lo demás, se proporciona sólo para la observación y no se considera como un consejo o una recomendación financiera. Todo el texto y cualquier parte suya, así como los gráficos no pueden considerarse como una oferta para realizar alguna transacción con cualquier activo. La compañía IFC Markets y sus empleados en cualquier circunstancia no son responsables de ninguna acción tomada por otra persona durante o después de la observación del resumen.
